How to Make Your Own Infographics
Of all the content we post to this site, infographics, without fail, get the most love from our readers.
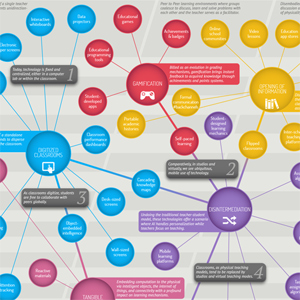
Given the increasingly visual — and, for that matter, social — world in which we live, it’s no wonder that educators and administrators have an affinity for our more colorful, data-driven resources. Infographics are at their best when they combine an interesting topic with clear visuals and statistics to tell a compelling narrative. Consider these examples:
Such resources not only encourage discussion but also are easily shared via social-networking applications — think Twitter and Pinterest.
But there’s another potential use we haven’t yet discussed — and it’s a game changer: What if you could make your own infographics and use them in class with your students? Given my limited — and I mean limited — grasp of design software, that thought would have seemed foreign to me a few weeks ago — before I stumbled upon this list of easy-to-use, make-your-own-infographic resources from the editors of Edudemic. Today, I at least speak the language. And you can, too.
Here are several to get you started:
Visual.ly

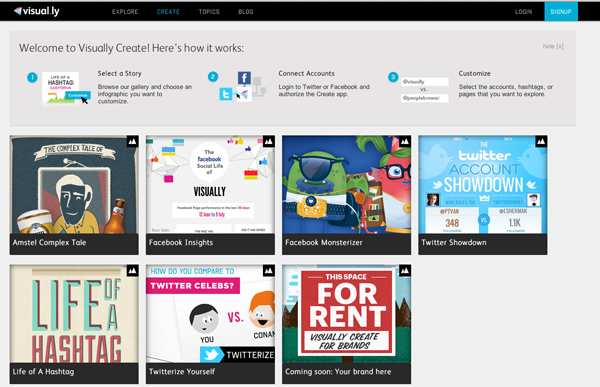
Among the most popular infographic resources, Visual.ly provides a forum for you to share custom infographics, a tool to create your own infographics, and a fee-based service, where professional designers will build custom infographics for you.
The service’s new Create tool lets users populate existing templates with data from their Facebook and Twitter accounts to publish free custom infographics. These tools are a nice way to introduce students and teachers to the power of infographics but, outside of a few preexisting templates, lack the customization that would allow novice users to create infographics from scratch.
Infogr.am

Infogr.am, on the other hand, provides fully customizable templates for creating and publishing online charts and graphics. Like Visual.ly, users can import data from existing social media accounts and publish custom creations directly to their online profiles or news feeds. The product lacks some of the more sophisticated design elements of Visual.ly, but what Infogr.am’s free product lacks in style it makes up for in customization and ease of use.
Piktochart

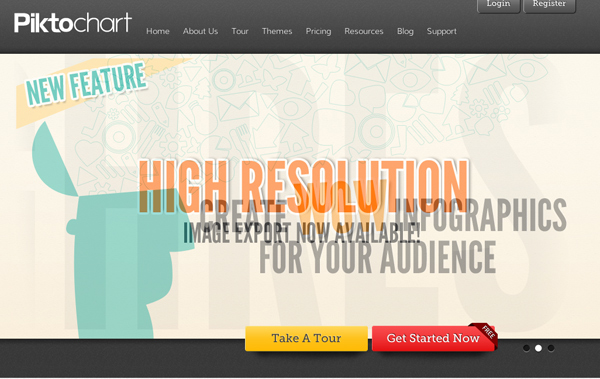
Of all the infographic tools out there, I’d have to agree with Edudemic that Piktochart is one of the best. As with other options, Piktochart offers a premium pay service that has more choices, but its free customizable templates are plenty robust for the novice infographic artist.
Register with an e-mail address or use your Facebook or Twitter accounts to get started, and immediately begin creating infographics by typing your own data into one of the templates. You can also save your creations and download them directly to your desktop. It doesn’t get much easier, or intuitive, than this!
Want more options for designing your own infographics? Read Edudemic’s full list and start designing today!


