Data Helps K–12 School Districts Hire, Set Curricula and Improve Student Outcomes
What does it take to manage four of the top-five public high schools in America, as ranked by U.S. News & World Report? For BASIS Curriculum Schools, the answer is next-generation technology, including analytics that inform not only curriculum planning, but also hiring, test creation and student performance.
“We’re doing pretty complicated analytical work on everything from the kids’ scores to specific questions on our exams,” says BASIS.ed CEO Peter Bezanson. “We have more IT, more analytics and more quantitative firepower than anyone else in the country.”
What makes this assertion especially interesting is that it all happens within the walls of BASIS’s 31 brick-and-mortar U.S. and international schools. For instance, Bezanson says he can open his computer and see where in the curriculum any teacher is on any given day, as well as how each student is performing compared with other students, other classes or other schools within the BASIS network, all using analytics and visualization.
“We’re using technology like a startup might,” says BASIS Educational Ventures CIO Matthew New. “We have a hybrid cloud on-premises. We’re using Hyper-V, Cisco blades, and Nimble solid-state storage. We have a hot standby with a dedicated fiber connection between our two data centers because it’s vital that all of our systems are highly available.”
Use Data to Enhance All Aspects of Education
While using analytics across all aspects of education might seem like micromanagement, schools that do so on a daily basis would beg to differ. For instance, at the Downingtown, Pa.-based 21st Century Cyber Charter School (21CCCS), teachers and administrators rely on learning tools such as Edmentum’s Study Island, Blackboard Collaborate and Moodle to identify student needs and trends.
“Using analytics allows us to modify assignments or input alternate information,” says Lauren Michener, the organization’s learning coach. “It helps with grouping students so we can make recommendations and move their path. It also helps us differentiate assignments. We’re able to think about the whole student.”
Analytics and next-gen tools may benefit personalized learning programs, especially as districts and charter schools struggle with standards and testing that don’t allow for much individuality. Digital tools provide an answer to this problem, says Leila Nuland, senior research adviser for K–12 at Hanover Research.
“Before we had these analytics tools, teachers had to pull together different tools and assessments manually,” Nuland says. “Now, teachers can use a tool and, based on how well each student does, ask one student to write an essay for a test while another student takes on a short answer. It used to be really difficult to have all these different activities happening at the same time.”

Now, she says, teachers can better understand a student’s strengths and weaknesses, collaborate with experts, integrate other online resources and get real-time feedback.
“The classroom is no longer the anchor it used to be,” Nuland says.
At K12 Inc., a national provider of online curriculum and support services for virtual public and private schools and homeschoolers, data and analytics help teachers pinpoint which of K12’s more than 100,000 full-time students and nearly 500,000 total students need help before they fall behind, says Chief Product Officer Doug McCollum.
“We can look at a test and see how a student performed, so we see which skills they are mastering and which they may be struggling with. Then we can target interventions for specific areas of need,” McCollum says. Children can be grouped together across the dispersed ecosystem.
Analytics Fosters Better Curriculum
Analytics also help districts and schools create the right curriculum for teachers and students. BASIS crowdsources its curriculum, asking the top-performing teachers, as measured by Tableau Software, to upload lesson plans and testing information to the network. Data also informs additional training for those teachers who are not as effective. Teachers view the analytics as a way to improve the quality of their teaching.
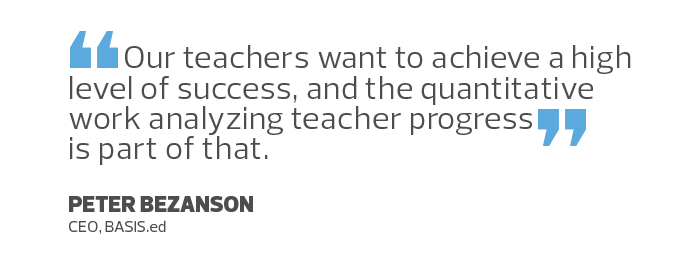
“Our teachers receive bonuses based on how well students do on tests such as the AP exams — they get $200 for each student who gets a five, which is the highest possible score,” says Bezanson. “Our teachers want to achieve a high level of success, and the quantitative work analyzing teacher progress is part of that.”
Nuland, from Hanover Research, says there’s currently a push across the country to use data to analyze not only how effective teachers are, but also how well districts and schools are making use of their disparate technology.
“Educators are spending big money adding technology like Chromebooks, videoconferencing and other distance-learning tools, but unless you’re tracking and analyzing student performance as it relates to that technology, you can’t be sure you are meeting teachers’ and students’ needs,” she says. “Especially as districts pilot technology in one school before rolling it out to all schools, analytics can help them merge use data and student test scores.”
Using analytics, BASIS educators can make sure that content and language are as appropriate for its Arizona schools as they are for those in China. K12’s McCollum says his organization, which is focused on expanding its schools to Asia, uses a continuous-improvement methodology, changing tests, course content and assessments almost daily based on both data and current events. If all of the students overseas get a question wrong that U.S.-based students overwhelmingly get right, it may be worded in a way or use jargon or slang that is unfamiliar to those students.

However, unless results are analyzed at a granular level, such an outcome may be overlooked. McCollum says it’s important to look at as much data as possible, something few educators are doing today.
“There are constantly new issues and new schools of thought,” he says. “Within K12, we have more than 20 platforms and systems that are proprietary, and we want to glean information from all of them.”
The real value of analytics is seen in student performance, says BASIS Co-Founder and Chairman Michael Block. Student graduation rates go up; there are fewer attendance problems; and teachers are happier, with fewer leaving the industry, he says.
“We’re really interested in finding what will create the optimal tenure of our teachers, so we’re constantly looking at data to help us do that,” Block says.


