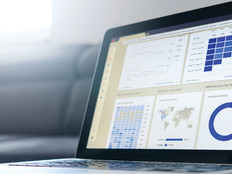
TCEA 2015: How to Inspire a Love of Big Data
When they're learning new things, kids and adults often ask, “I don’t get it. When am I ever going to need to know this?”
Data is no stranger to this kind of thought. When we are presented with mountains of data, our eyes tend to glaze over. But data isn’t going anywhere. Every day, more and more data is collected, and it's coalescing into Big Data.
“Data is all around us,” says Joel Adkins, director of digital learning at Crandall Independent School District. “Big Data is large data sets that may be analyzed computationally to reveal patterns, trends and associations, especially relating to human behavior and interactions.”
Examples of Big Data in action include the Nike Fitbit, which gathers information on a person’s activity, or sponsored ads reflecting searches or keywords a person typed, Adkins says.
The Internet of Things (IoT) also is playing a part in the growing amount of data available. The IoT allows devices and other things to be connected to the Internet. As the IoT grows, more things will be connected to the Internet, giving us more data to analyze.
Managing 'Deep Analytics' Has Become a Highly Marketable Skill
Despite the influx of data, schools aren’t doing data projects or teaching data analytics in the classroom. Why not? Money: Glassdoor lists the average salary for a data scientist as $118,709, versus $64,537 for a programmer, Adkins notes, adding that a McKinsey study predicts that by 2018, the U.S. could face a shortage of 140,000 to 190,000 “people with deep analytic skills,” as well as 1.5 million “managers and analysts with the know-how to use the analysis of Big Data to make effective decisions.”
EdTech is covering TCEA 2015, including articles on breakout sessions, keynotes and the pulse on social media. Keep up-to-date on all of our coverage by visiting our TCEA 2015 conference page.
How do we turn this trend around?
“The goal to get students engaged in data analysis is to ask tough questions and let students find data to answer those questions,” Adkins says.
One resource Adkins uses that can help students access databases and find data is TexQuest, a digital resources program at the Texas State Library and Archives Commission that provides free anytime, anywhere access to high-quality, authoritative digital resources to all educators and students in Texas.
“If you can tie data collection projects into real-world scenarios, you can get students interested in finding data,” Adkins says. Examples include using vehicle data to increase car safety and using traffic data to help build a new road or highway to ease congestion.
Another way to get students engaged in data is by using infographics, Adkins points out. Infographics display complicated statistics so they can be comprehended easily. Adkins says he uses websites such as Piktochart, Canva and Easel.ly to help create free infographics and present data.
What's Happening in the World of Big Data?
Data can be fun! Joel Adkins, director of digital learning at Crandall ISD, shows a couple of examples of how interpreting data can be interesting:
- The Internet in Real-Time
See how much has been created at some of the most popular websites. - How is America feeling right now?
Get a read on how parts of the country are feeling at the moment, based on Tweets.


