Colleges Embrace Data Analytics to Improve Student Retention
As more states adopt funding formulas based on student performance — such as graduation rates and degrees awarded — higher education institutions are laser-focused on improving retention. Regardless of state policy, however, such strategies make fiscal sense: Enrolling a new student is more expensive than retaining a current one. To both control those costs and serve students more effectively, many institutions leverage data analytics.
Temple University’s Fox School of Business developed its analytics initiative in concert with a major curriculum review, which included surveying businesses and focus groups about the competencies they look for in graduates. The school then looked for a way to help students measure their competencies in an integrated, cross-course fashion.
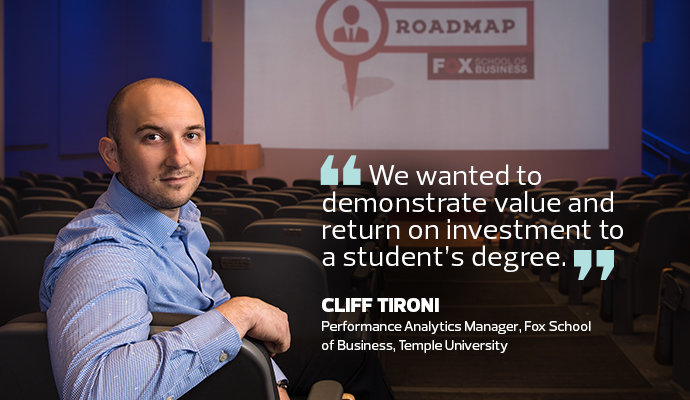
“We wanted to demonstrate value and return on investment to a student’s degree,” says Cliff Tironi, Fox’s performance analytics manager.
Data Creates a New Kind of Report Card
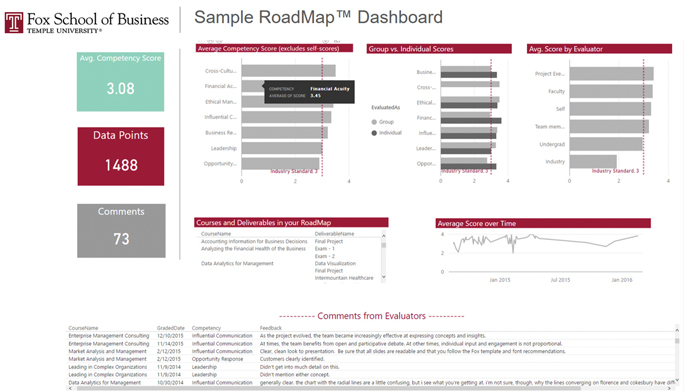
At Temple, it helped that Fox already had extensive data in its learning management system (LMS). Using that as a starting point, Fox built an interface, powered by Microsoft Power BI, that helps students identify their strengths and weaknesses. This real-time dashboard, dubbed RoadMap, is also a powerful demonstration of applied analytics for future MBA candidates who will enter a data-driven business world.
“It’s a deconstructed and repackaged report card,” says Tironi, who created RoadMap with Fox Associate Vice Dean Christine Kiely. “Students can view their progress in a way they never could with the traditional LMS.” For example, a student can look at the feedback he or she received on a particular skill — say, all courses with a presentation element — rather than rely on a string of letter grades, which reflect classwork in a wide variety of skill sets.

Those insights support more holistic conversations between students and their advisers, Tironi says. Now, instead of simply meeting credit requirements, advisers help students pick classes that develop well-rounded competencies.
Tironi points out that RoadMap doesn’t require professors to change their teaching methods. They already mapped exams to competencies and rubrics, so RoadMap is essentially an invisible layer of analysis, taking data that was latent in the LMS and using it in a new way. By automating the data-gathering process, researchers can spend more time on high-level analyses.
Analytics Detect Early Warning Signs
While Temple University takes a holistic approach to students’ development, the University of Nevada, Las Vegas uses course-level corrections to keep students on track. Consider UNLV’s Anatomy and Physiology, an introductory course that enrolls 1,200 students each year — half of whom fail.
In that stark statistic, Matthew Bernacki saw an opportunity. Bernacki, an assistant professor of educational psychology, had conducted extensive research into student achievement at UNLV. He recognized that data analytics could help flag students who are at risk of failing a course so that instructors can provide timely interventions.
“Students really are generating the same data that can inform their own learning practices, if we can provide them with some sort of intervention based upon it,” Bernacki says.
UNLV started using Splunk in 2010 to increase the visibility of LMS logs on servers, says Cam Johnson, an IT operations center manager. Today, the team uses Splunk Enterprise 6.5.1 and is starting to incorporate Splunk’s Machine Learning Toolkit. Tools like this have the power to put data to dynamic use.
Insights Lead to Well-Timed Intervention
Bernacki started his experiment with the Anatomy and Physiology course that was a stumbling block for so many students. He first worked with professors to digitize learning materials.
“It’s those materials that give us the signal,” he says. “What students click on — and when — helps us do the prediction.”
Bernacki built a prediction model that establishes connections between students’ academic activities and their likely outcomes in the course. That, in turn, informs an intervention strategy designed to help students when they need it most. Timing is everything, Bernacki says:
“Typically, the goal is to intervene and get in front of students digitally before they start to perform poorly on tests.”
In this case, students who appear to be in jeopardy receive an email a week before the first test to remind them of the upcoming exam and direct them to study materials (including tips for success based on the study practices of students who got A and B grades in the class).

“It’s not adaptive in the sense of letting them know what content areas they’re weak on,” says Bernacki. The data for that kind of intervention is not yet available. But what he does have, thanks to Johnson’s work with Splunk and his own research, is access to real-time, course-specific, theory-aligned predictors of success.
About half of the students respond to the messages they receive. In the pilot, about a third of students who received interventions did better than expected in the course.
Proactive Planning via Data
At Southern Connecticut State University, analytics picks up where recruitment ends and retention begins: with a survey at new student orientation. Among other questions, the survey asks students if there is any reason they might not come to campus in the fall, says Michael Ben-Avie, director of the Office of Assessment and Planning.
Depending on students’ responses, Ben-Avie and his team may circulate red flags to the appropriate campus offices, marshalling the resources a student might need to follow through with attendance plans.

“The red flags and the full report are distributed within one day after an orientation session,” says Ben-Avie. “We demonstrate to the students that we care about them by responding immediately.”
SCSU continues to gather data over time and reach out to students proactively. Ben-Avie’s office, for example, employs a handful of students who analyze student success models using IBM Watson Analytics. According to Ben-Avie, they pride themselves on discovering patterns in the data that can overturn conventional college administrator wisdom. Data-driven insights can help administrators and students focus on areas within their control (rather than, for example, a student’s lack of preparation before college).
“We focus on what happens in the college classroom, the on-campus experiences,” Ben-Avie says. “We change the conversation about the students and focus on our efficacy.”


