March Madness 2015: College Basketball by the Numbers [#Infographic]

Data rules everything around us and the game of basketball is ripe with opportunity for teams' to score big by leveraging analytical insights.
STATS LLC has rolled out its innovative SportVU player-tracking technology across the NBA and it’s making its way into NCAA Men’s College Basketball as well. We've recently covered how college teams at Duke University and Colorado State University have reaped the rewards of their newly installed SportVU systems.
Using data sourced by STATS LLC from the recent SEC and ACC tournaments, in addition to team-specific data provided by the aforementioned universities, we compiled an infographic that illustrates the difference between what the human eye sees during a college basketball game and what the analytical eye sees.
Here's a sampling of the kinds of insights made available thanks to this new technology:
- The University of Georgia allowed opponents to shoot just 27% when contested at the rim in this year’s SEC tournament.
- The University of Kentucky allowed 33 offensive rebounds during the SEC tournament.
- Duke University achieved a 33% success rate with 3-pointers off the dribble in the 2014-2015 season.
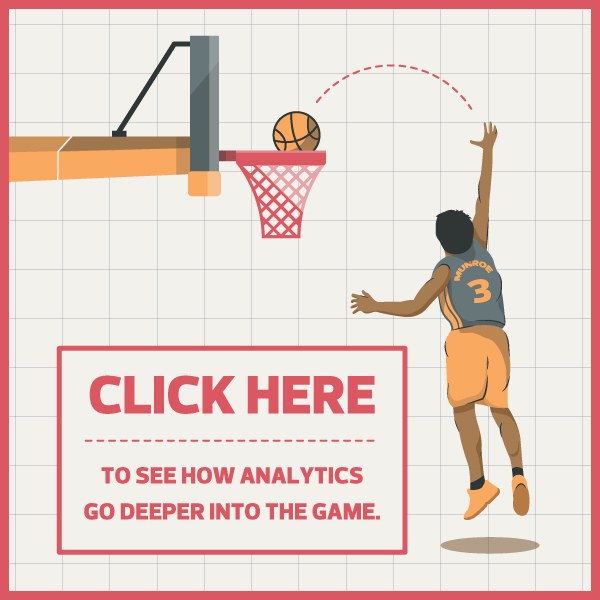
Click the thumbnail below to see data analytics insights come to life in our interactive infographic.