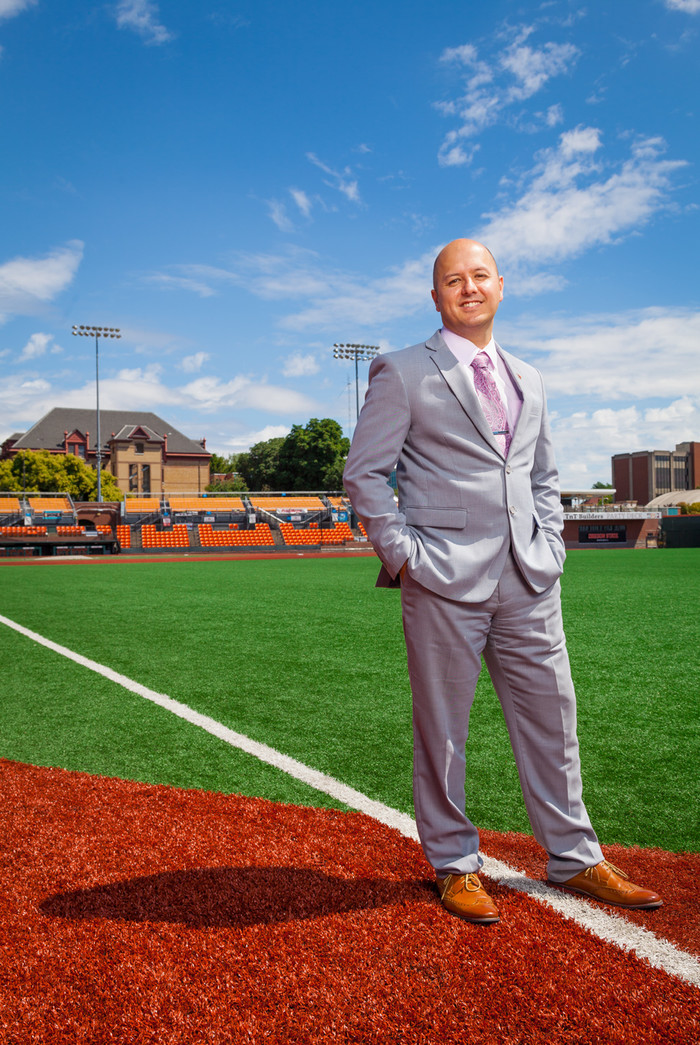
“It allows us to directly connect to their scoring database, which was also built here at Oregon State,” says Tim De Quilettes, IT director for Oregon State University Athletics.
Data Analytics Helps College Coaches and Athletes Optimize Training and Performance
Microsoft Power BI and other tools yield insights to refine the art and science of collegiate competition.
Like most coaches in Division I collegiate baseball, those at Oregon State University are keenly interested in game-related data. Statistics have long been essential to the sport, key to understanding each player’s potential impact on any given day.
Yet over the course of the past year or so, as the OSU Beavers — the 2018 national champs — have continued to play and train, this interest has grown into a near obsession. Data is central to coaches’ preparation — and, they believe, key to the team’s success.
“It’s not that the data wasn’t there in the past,” says Tim De Quilettes, IT director for Oregon State University Athletics. “But now we have tools that let them see it more holistically and really dig deep into the analytics.”
De Quilettes, hired by OSU to join its Data and Media Infrastructure Team, has since 2017 divided his attention between “normal IT support work” and what he describes as a departmentwide effort to “revolutionize how technology is used in intercollegiate athletics.”
As part of that initiative, his staff elected to rely on two solutions from Microsoft: Power BI, a cloud-based business analytics service, and SharePoint, an online collaboration platform.
Power BI lets them collect, filter and analyze a wide range of data from the university’s athletic teams, while SharePoint creates easy-to-read dashboards that coaches use to view Power BI reports. At the program’s launch, De Quilettes recalls, the volume of data being collected was relatively small. But soon, as more teams got involved, his staff bolstered its Dell EMC Isilon data storage system by investing in the company’s Unity platform as well.
“To do what we wanted and to host the technologies we implemented, we had to have a robust infrastructure,” he says.
How Data Analytics Informs Collegiate Athletics
For OSU’s baseball coaches, the benefits of partnering with IT staff were clear. With Power BI crunching the numbers, they could easily use data on variables such as pitch velocity to determine whether a pitcher was throwing at his best. They could compare his performance against left- and right-handed batters, or his ability to throw strikes early versus late in a game.
The hitting and fielding coaches also began to incorporate data analytics, and soon other teams across the OSU campus were clamoring for the department’s services. “With swimming, for example, we’re now taking video data from their practices to help coaches look at a swimmer’s strokes frame by frame,” says De Quilettes.
His team crafted a new application for the gymnastics program. To track athletes’ spins and jumps, they repurposed a camera system originally used in the college of engineering to analyze the micromovements of ocean waves.
“Gymnasts move so fast, and their motions are so precise — but now coaches can break down everything into the smallest details,” says De Quilettes. “They’re able to see things they couldn’t see before.”
95%
Players’ availability for games and practices on the University of Louisville women’s basketball team when wearables, self-reports and IBM Analytics were used to reduce injury
Source: IBM, “University of Louisville,” August 2018
Growing Interest in Data Informing Student-Athletics
It’s hard to know for sure how many institutions are leveraging data to elevate student-athlete performance, but the number is certainly growing, says Bradley Smith, an instructor of sports performance analytics at Northwestern University.
Smith, who also provides data services to a professional baseball team he’s not allowed to name, previously worked in the department of sports analytics at the University of Nebraska–Lincoln. That department, established in 2015, was the first of its kind to span all sports in a Division I program. The OSU project may be the second, and now many other institutions are pursuing similar initiatives, although typically at a much smaller scale.
At the University of Virginia, for example, engineering students have developed analytics tools to support decision-making on and off the field for the Virginia Cavaliers football team. The University of Rochester uses commercially available products to analyze everything from basketball players’ jump shots to the defensive strategies of opposing soccer teams.
Conferences are popping up too. A colloquium hosted by the National Center for Supercomputing Applications at the University of Illinois at Urbana-Champaign, for instance, featured a discussion on “the need for, and benefits of, scientific analysis and visualization in collegiate athletics.”
The trend toward athletics departments and team coaches looking to Big Data for actionable insights will come as no surprise to anyone who has read books such as Michael Lewis’s best-selling Moneyball, Smith notes. “Everybody is trying to get that competitive advantage, so it’s kind of become the new normal now,” he says. “I think that very soon we’re going to see that the teams that don’t use analytics — they’re going to be left behind.”
Back to the article
Exit Full Screen
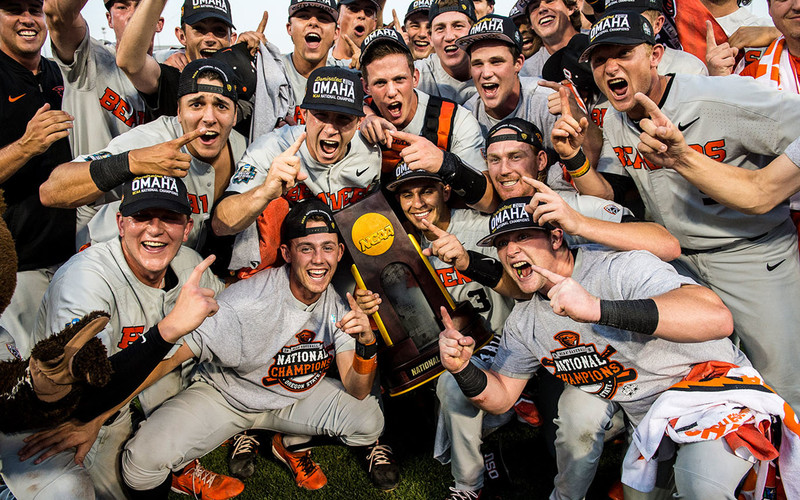
Members of the OSU baseball team celebrate their 2018 national championship win.
Karl Maasdam/Oregon State University (OSU Baseball Team)
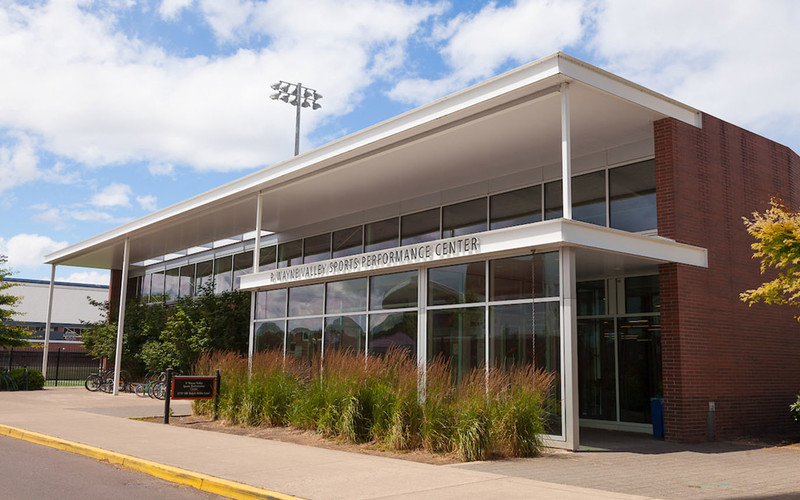
The $16 million P. Wayne Valley Sports Performance Complex at OSU underwent a $3.5 million remodel in 2019.
Robbie McClaran
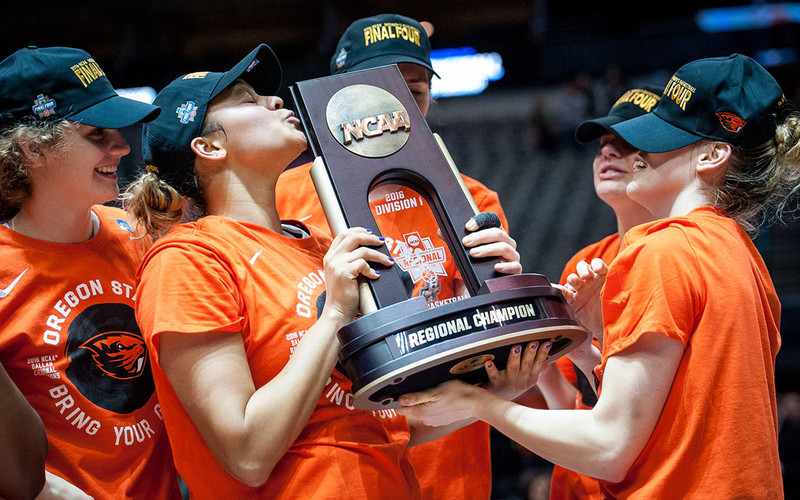
OSU women's basketball players captured the 2016 Final Four trophy in a 60-57 win against Baylor.
Karl Maasdam/Oregon State University
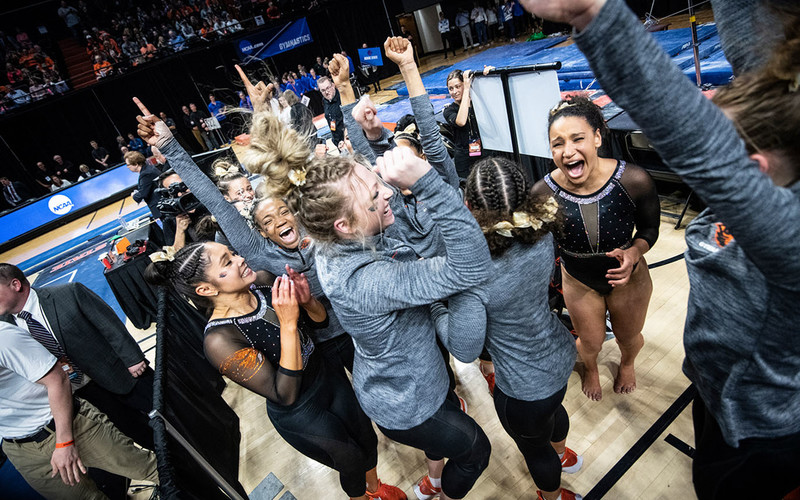
OSU gymnasts exclaim as they score that sent them to the 2019 NCAA Gymnastics Championships finals is revealed.
Karl Maasdam/Oregon State University
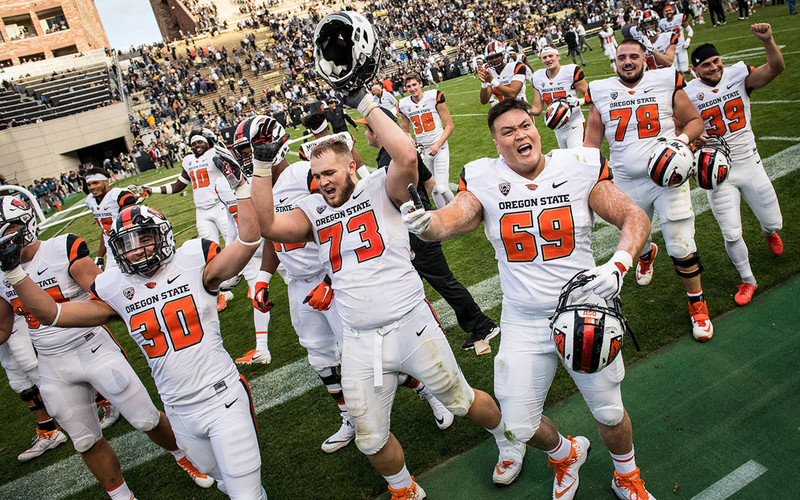
The 2018 Beaver football team pours out emotion after a triumph over Colorado, in which OSU overcame a 28-point deficit to win in overtime.
Karl Maasdam/Oregon State University
Members of the OSU baseball team celebrate their 2018 national championship win.
Karl Maasdam/Oregon State University (OSU Baseball Team)
The $16 million P. Wayne Valley Sports Performance Complex at OSU underwent a $3.5 million remodel in 2019.
Robbie McClaran
OSU women's basketball players captured the 2016 Final Four trophy in a 60-57 win against Baylor.
Karl Maasdam/Oregon State University
OSU gymnasts exclaim as they score that sent them to the 2019 NCAA Gymnastics Championships finals is revealed.
Karl Maasdam/Oregon State University
The 2018 Beaver football team pours out emotion after a triumph over Colorado, in which OSU overcame a 28-point deficit to win in overtime.
Karl Maasdam/Oregon State University
Back to the article
Exit Full Screen
Members of the OSU baseball team celebrate their 2018 national championship win.
Karl Maasdam/Oregon State University (OSU Baseball Team)
The $16 million P. Wayne Valley Sports Performance Complex at OSU underwent a $3.5 million remodel in 2019.
Robbie McClaran
OSU women's basketball players captured the 2016 Final Four trophy in a 60-57 win against Baylor.
Karl Maasdam/Oregon State University
OSU gymnasts exclaim as they score that sent them to the 2019 NCAA Gymnastics Championships finals is revealed.
Karl Maasdam/Oregon State University
The 2018 Beaver football team pours out emotion after a triumph over Colorado, in which OSU overcame a 28-point deficit to win in overtime.
Karl Maasdam/Oregon State University
Technology's Influence on the Art and Science of Coaching
Another institution that’s embracing data-driven insights is William & Mary in Williamsburg, Va.
The Tribe, as W&M’s athletics teams are collectively known, includes men’s and women’s cross-country, tennis and other programs.
Until 2018, these college athletes generally prepared for meets and matches much as they did in high school: by practicing as hard as possible. Today, however, they also rely on insights from an assortment of data to help them reach peak performance over the course of a season.
Scott Kuehn, who joined W&M last year as the athletics performance coach and data science coordinator, describes himself as “first and foremost a coach.” He says data analytics is “a way to offer more objective guidance.”
Using heart rate monitors, GPS software and other tools for physiology and movement tracking, he collects data from teams and individuals and runs it through the spreadsheet program Google Sheets to create dashboards full of information. He also uses wellness surveys, sent via Google Forms, that ask athletes to rate issues such as soreness and sleep quality.


“All of these metrics put together can give a really good broad-scale picture of how that person is doing on a daily basis, and how they’re responding to training,” Kuehn says. “It’s kind of blending the line between the art and science of coaching.” Recently, he worked with a member of the W&M women’s lacrosse team. As a senior prelaw student, “she had a huge academic workload, and in each of the previous years she played, she’d always be burned out by the second half of the season.”
This athlete had high potential, Kuehn says, “but could never really produce, when they got to conference play, the way she and her coaches knew that she could.” Coaches deployed their monitoring tools, as they did with everyone else on the team, to analyze details such as the athlete’s running speed and distance and how they varied from game to game.
“We also did the constant subjective checking of, ‘Hey, how are you feeling today?’” Kuehn says. As the season progressed and the data came in, they determined it made sense to cut back on her training. “We knew we’d get more out of her by asking her to do a bit less.”
Overall, says Kuehn, the current women’s lacrosse players have seen far fewer injuries than previous players who didn’t train with data. Coaches also saw “tremendous improvements in physical capability,” including metrics like the timed 40-yard dash. Also worth noting: The players won more games this year.
As for the prelaw student, at the end of the season she was still going strong, says Kuehn.
“I checked in with her with about six weeks to go and asked her how she felt then versus previous years at that point,” he says. “She looked at me and her face lit up. She said that when she played, she felt like her legs were underneath her. She said her mind felt clearer and her body was exponentially better.”
The conversation was reaffirming: “To see her healthy and playing as hard she could — that’s when I knew that what we were doing could really make a significant difference.”
Robbie McClaran (Tim De Quilettes); Karl Maasdam/Oregon State University (OSU Baseball Team)